Back
12 Mar 2020
GBP/JPY Price Analysis: Five-month-old support trendline in focus
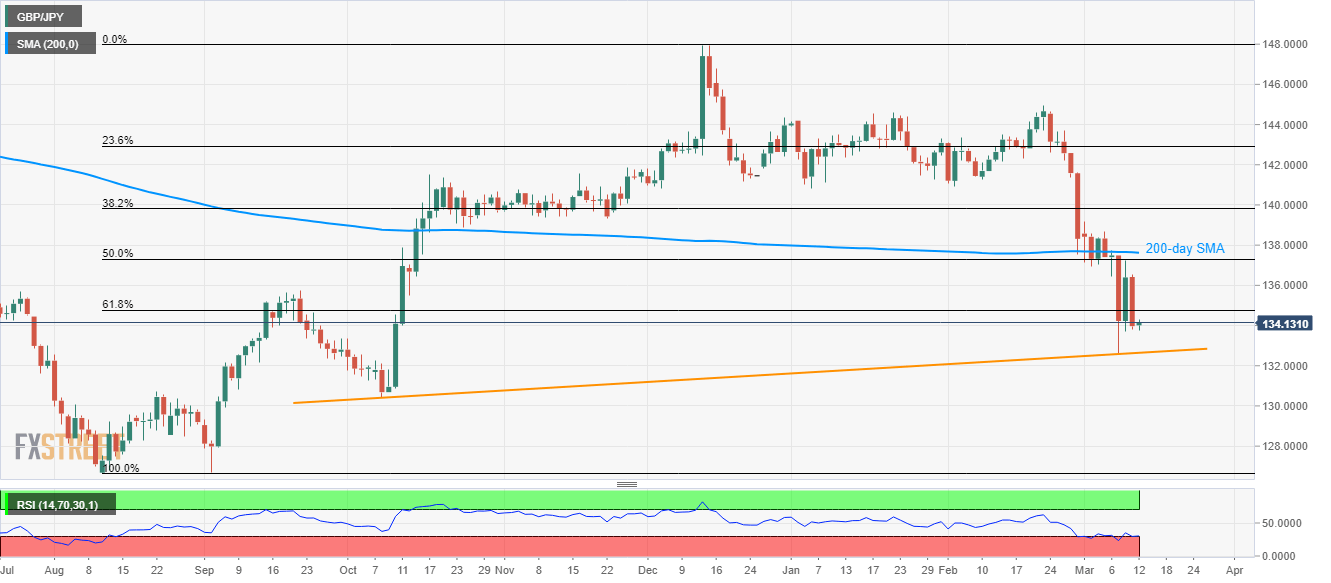
- GBP/JPY remains depressed around 61.8% Fibonacci retracement of its August-October 2019 upside.
- Sustained trading below 200-day SMA gradually directs the pair to the medium-term support line.
While portraying its another decline below 61.8% Fibonacci retracement, GBP/JPY seesaws around 134.15 during Thursday’s Asian session.
Although oversold RSI conditions repeatedly offer pullback moves to the pair, it's sustained trading below 200-day SMA, currently at 137.65, restrict near-term upside.
Should there be a clear break of 137.65, November 2019 low near 139.30 and 140.00 round-figure can return to the charts.
Alternatively, an upward sloping trend line since October 2019, at 132.65, can offer nearby support during the quote’s further declines.
In a case where the bears dominate past-132.65, October month low near 130.40 will be their favorite.
GBP/JPY daily chart
Trend: Bearish