Back
6 Feb 2020
Gold Asia Price Forecast: XAU/USD recovering and approaching 1570/75 resistance zone
- The bulls are forming a base above $1550/oz level.
- The 1570/75 area is a strong resistance zone.
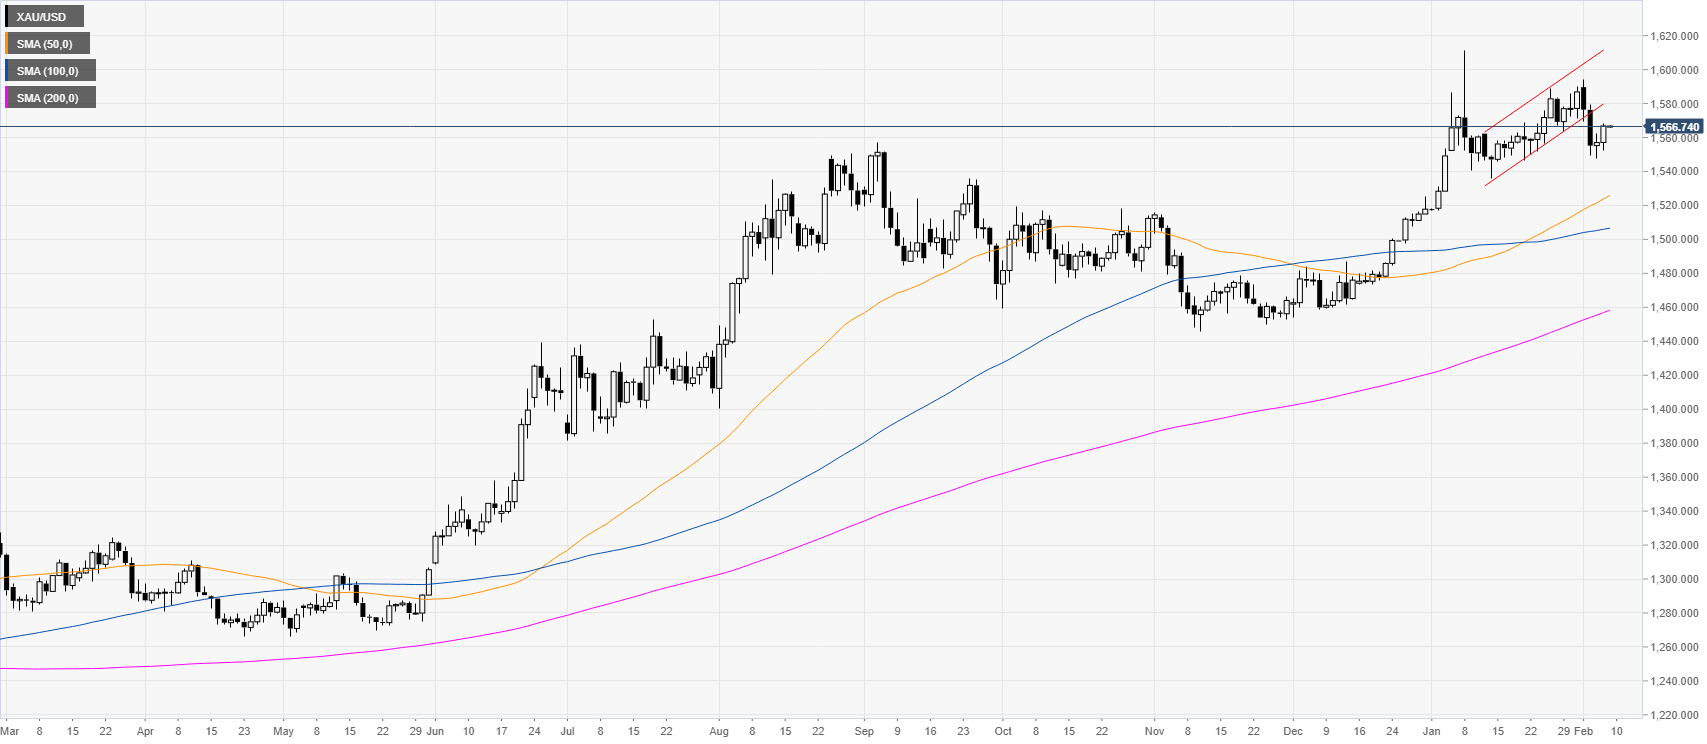
Gold daily chart
XAU/USD is trading in an uptrend above its main daily simple moving averages (SMAs). However, gold broke below a bear flag and the market recovered slightly this Thursday.
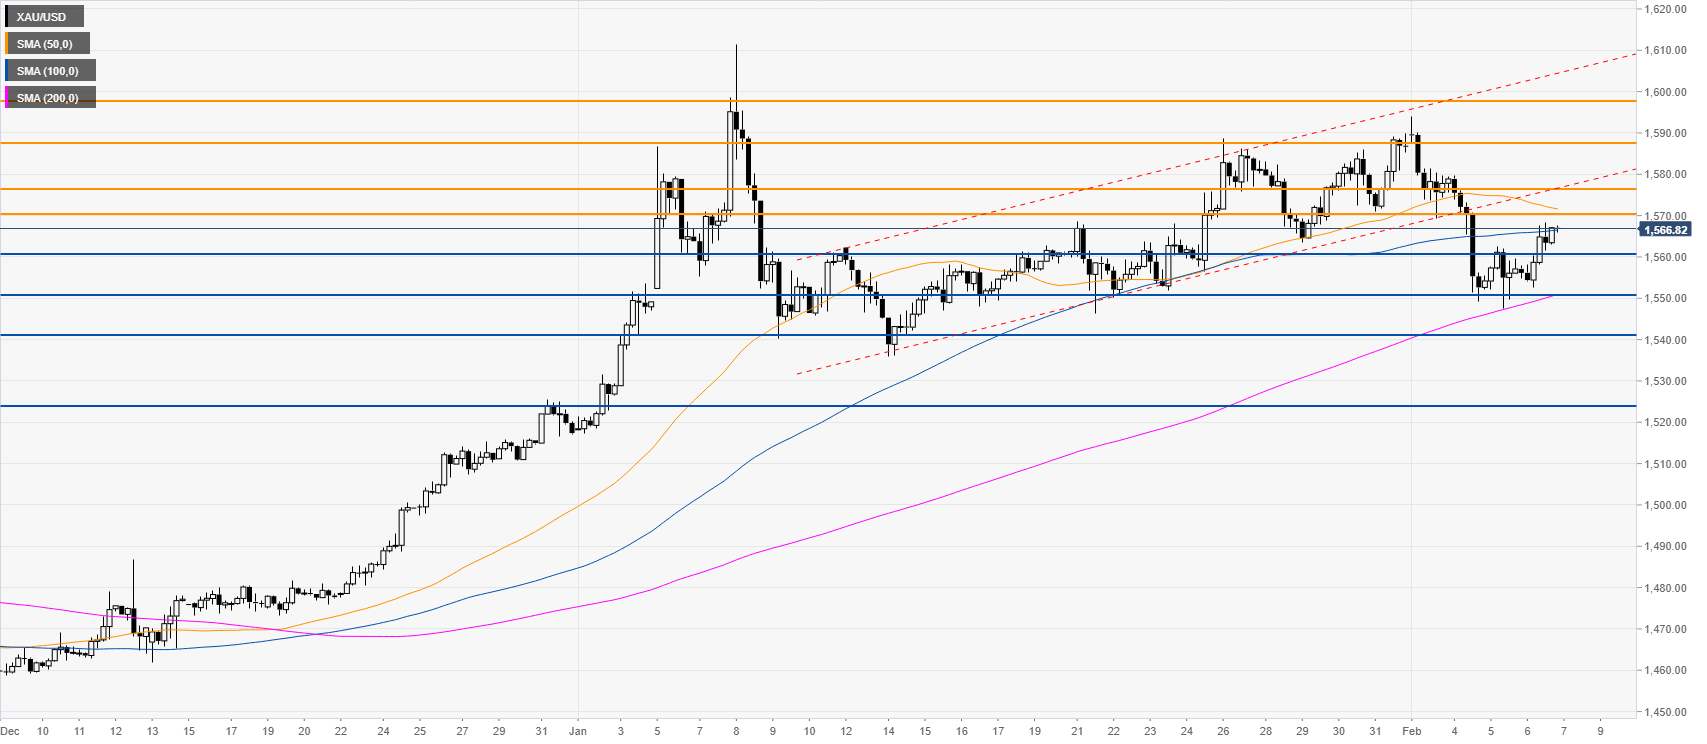
Gold four-hour chart
Bulls are forming a base near the 1550 level and the 200 SMA on the four-hour chart. The buyers would need a clear breakout above the 1570/75 resistance zone to resume the bullish bias. On the flip side, if the metal fails to make any major progress above the above-mentioned price zone, XAU/USD could become vulnerable to another bearish incursion. If bears break below the 1550 support, it can expose the 1540 and possibly the 1525 level on the way down.
Additional key levels