US Dollar trades flat as traders make way to the Christmas table
- The US Dollar trades broadly steady despite headlines out of China about ramping up bond sales next year.
- Chinese policymakers plan to sell a record 3 trillion yuan of special treasury bonds in 2025, the highest on record.
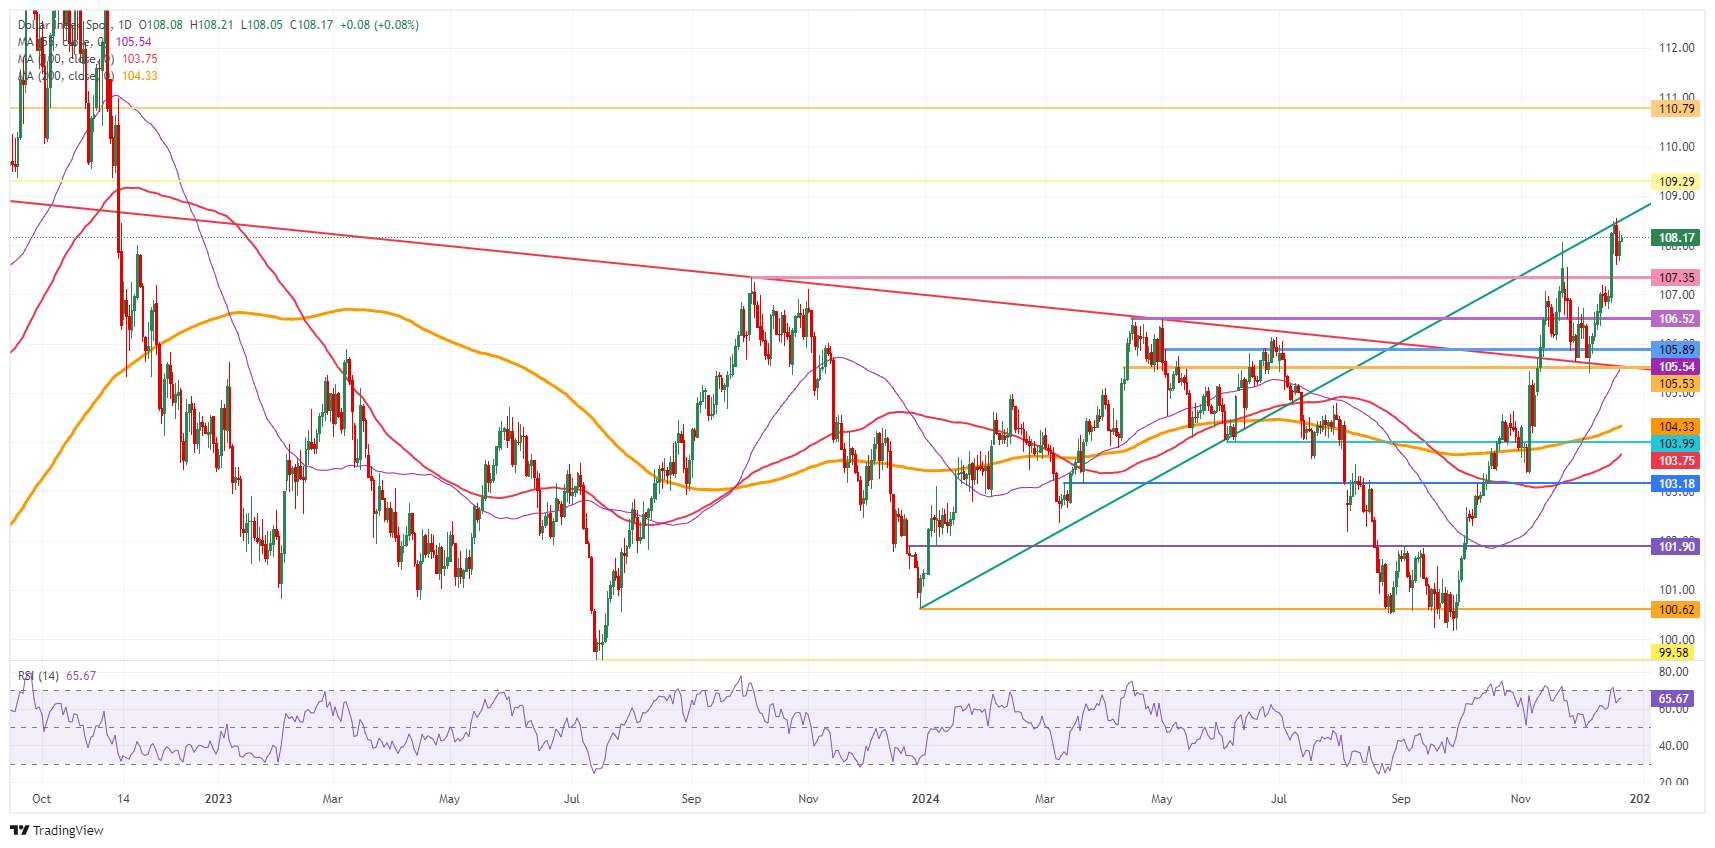
- The US Dollar Index (DXY) resides at 108.00, very close to eke out a fresh two-year high.
The US Dollar (USD) trades sideways on Tuesday, with the DXY Index slightly above 108.00, as markets are starting to unwind towards the Christmas holiday. The Greenback failed to significantly move despite news that China’s policymakers are floating the idea of selling nearly 3 trillion Yuan (CNH) in special treasury bonds in 2025, Reuters reported on Tuesday. The additional capital should boost the slowing and sluggish Chinese economy.
The US economic calendar is a very light one on Tuesday, with just minor indicators such as the Philadelphia Fed Non-Manufacturing Activity Index and the Richmond Fed Manufacturing Index regional surveys for December. One main takeaway for the last few data points of December is that the US manufacturing sector is sounding the alarm bell, with several indicators confirming the sector is falling further into contraction.
Daily digest market movers: Light participation
- Policymakers in China plan to sell a record 3 trillion Yuan ($411 billion) of special treasury bonds in 2025, Reuters reported Tuesday. The government seeks to support consumption subsidies, business equipment upgrades as well as investments in key technology and advanced manufacturing sectors, according to Reuters.
- French Prime Minister Francois Bayrou aims to reach an agreement with parliament on a 2025 budget that would reduce the deficit to close to 5%, near the level of his predecessor Michel Barnier, Bloomberg reports.
- Near 13:30 GMT, the Philadelphia Fed Non-Manufacturing Activity Index for December is published. The previous reading stood at -5.9.
- At 15:00 GMT, The Richmond Fed Manufacturing Index is expected to stay in contraction at -9 coming from -14.
- Asian equities are fired up after the 3 trillion Yuan expected injection from China. Europe is rather struggling to benefit from that tailwind and remains looking sluggish. US futures are marginally in the green.
- The CME FedWatch Tool for the first Fed meeting of 2025 on January 29 sees a 91.4% chance for a stable policy rate against a small 8.6% chance for a 25 basis points rate cut.
- The US 10-year benchmark rate trades at 4.59%, the high of last week.
US Dollar Index Technical Analysis: Final straw
The US Dollar Index (DXY) is trading in a rather narrow range this Tuesday. More and more traders will not participate in markets today, which will mean nearly no reaction in prices unless a big headline comes up. It thus looks like the DXY is set to close off Christmas eve very close to a two-year high.
On the upside, a trend line originating from December 28, 2023, is acting as a moving cap. The next firm resistance comes in at 109.29, which was the peak of July 14, 2022, and has a good track record as a pivotal level. Once that level is surpassed, the 110.00 round level comes into play.
The first downside barrier comes in at 107.35, which has now turned from resistance into support. The second level that might be able to halt any selling pressure is 106.52. From there, even 105.53 could come under consideration while the 55-day Simple Moving Average (SMA) at 105.23 is making its way up to that level.
US Dollar Index: Daily Chart
US Dollar FAQs
The US Dollar (USD) is the official currency of the United States of America, and the ‘de facto’ currency of a significant number of other countries where it is found in circulation alongside local notes. It is the most heavily traded currency in the world, accounting for over 88% of all global foreign exchange turnover, or an average of $6.6 trillion in transactions per day, according to data from 2022. Following the second world war, the USD took over from the British Pound as the world’s reserve currency. For most of its history, the US Dollar was backed by Gold, until the Bretton Woods Agreement in 1971 when the Gold Standard went away.
The most important single factor impacting on the value of the US Dollar is monetary policy, which is shaped by the Federal Reserve (Fed). The Fed has two mandates: to achieve price stability (control inflation) and foster full employment. Its primary tool to achieve these two goals is by adjusting interest rates. When prices are rising too quickly and inflation is above the Fed’s 2% target, the Fed will raise rates, which helps the USD value. When inflation falls below 2% or the Unemployment Rate is too high, the Fed may lower interest rates, which weighs on the Greenback.
In extreme situations, the Federal Reserve can also print more Dollars and enact quantitative easing (QE). QE is the process by which the Fed substantially increases the flow of credit in a stuck financial system. It is a non-standard policy measure used when credit has dried up because banks will not lend to each other (out of the fear of counterparty default). It is a last resort when simply lowering interest rates is unlikely to achieve the necessary result. It was the Fed’s weapon of choice to combat the credit crunch that occurred during the Great Financial Crisis in 2008. It involves the Fed printing more Dollars and using them to buy US government bonds predominantly from financial institutions. QE usually leads to a weaker US Dollar.
Quantitative tightening (QT) is the reverse process whereby the Federal Reserve stops buying bonds from financial institutions and does not reinvest the principal from the bonds it holds maturing in new purchases. It is usually positive for the US Dollar.

