GBP/USD Price Analysis: Bulls eye 1.1750s, but bears are ready to pounce
- GBP/USD bulls take charge mid-week on risk-on sentiment.
- The bears are lurking at the critical weekly structure.
GBP/USD bulls are taking charge following a significant rally mid-week that has left the emphasis, for the near term, on a correction, but with the risk of a continuation towards weekly structure as the following technical analysis across multi-timeframe charts will illustrate:
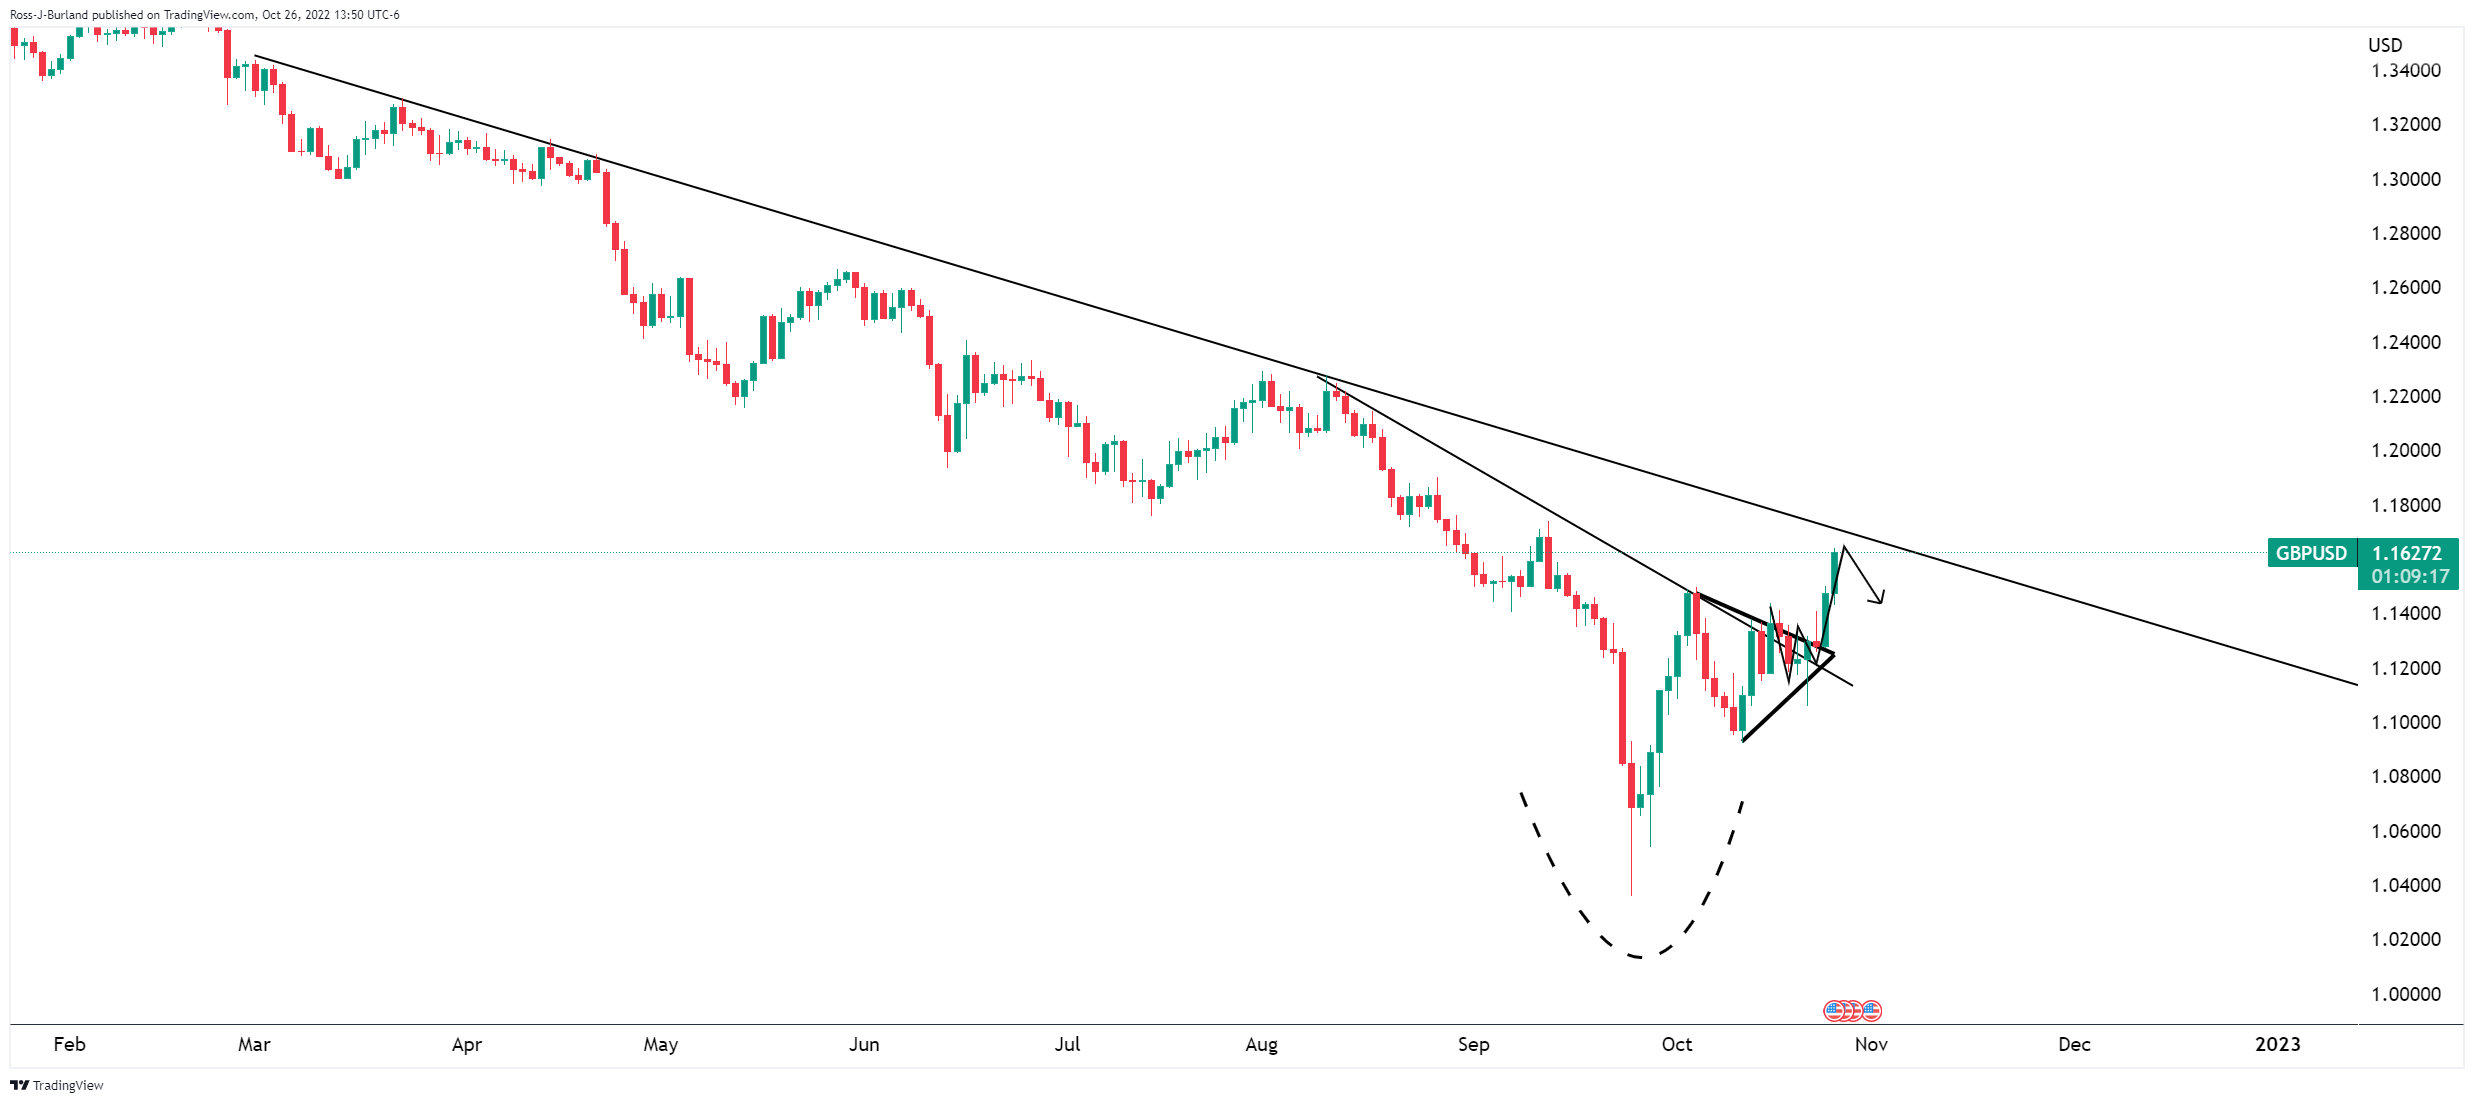
GBP/USD weekly chart
The weekly chart shows that the price could move in on the 1.1750s before the week is out but the W-formation is a bearish reversion pattern.
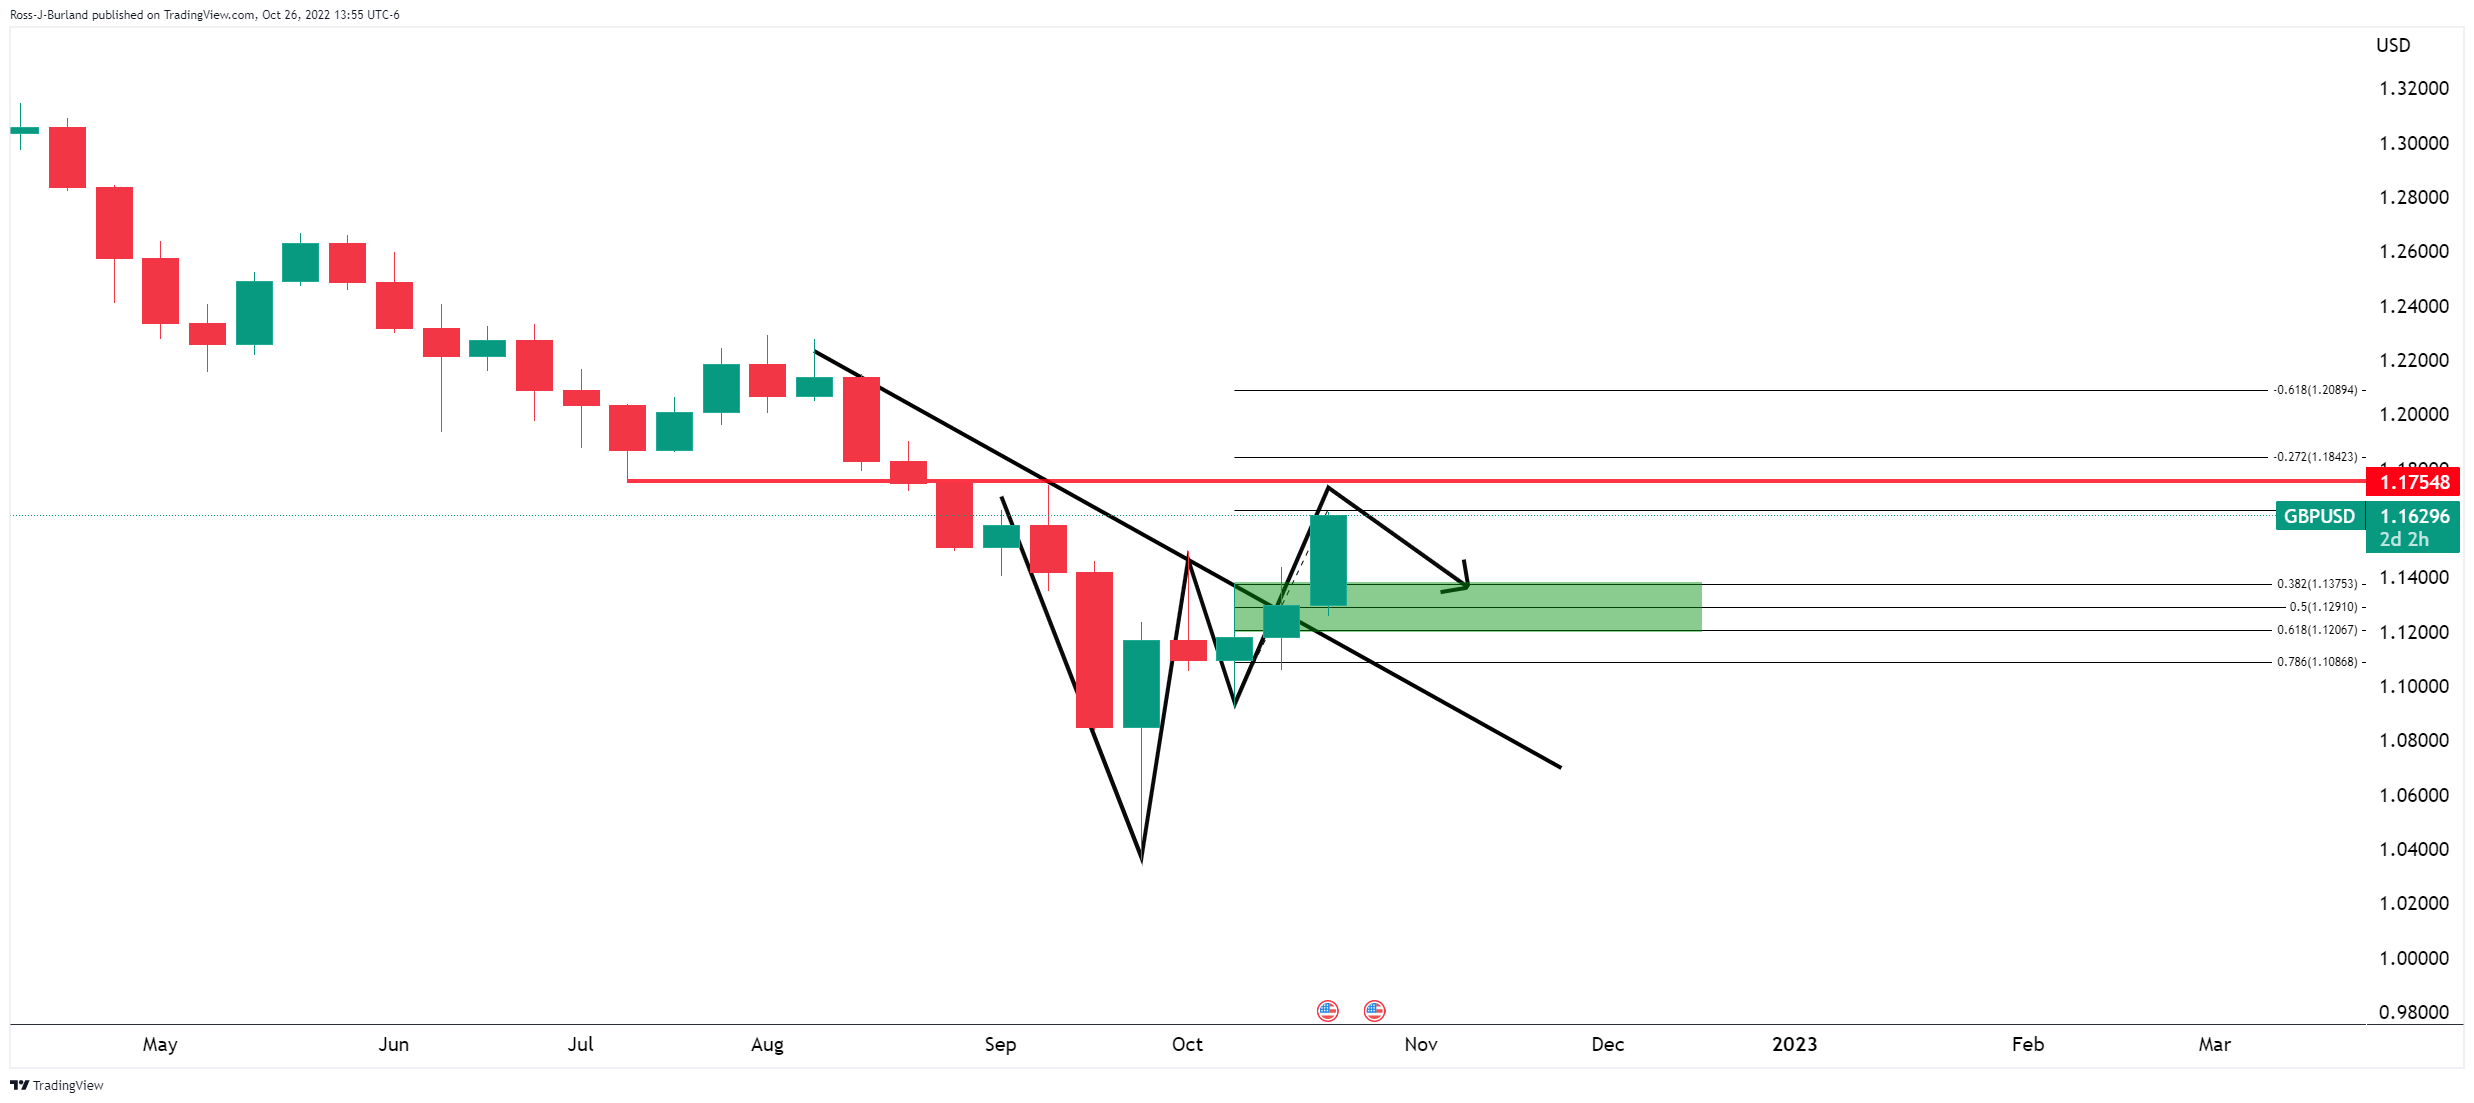
GBP/USD daily charts
The price rallied out of a micro daily symmetrical triangle following the peak formation in a V-bottom. However, the W-formation, which we will go into more detail below, is a bearish reversion pattern as the price heads towards a more dominant trendline resistance:
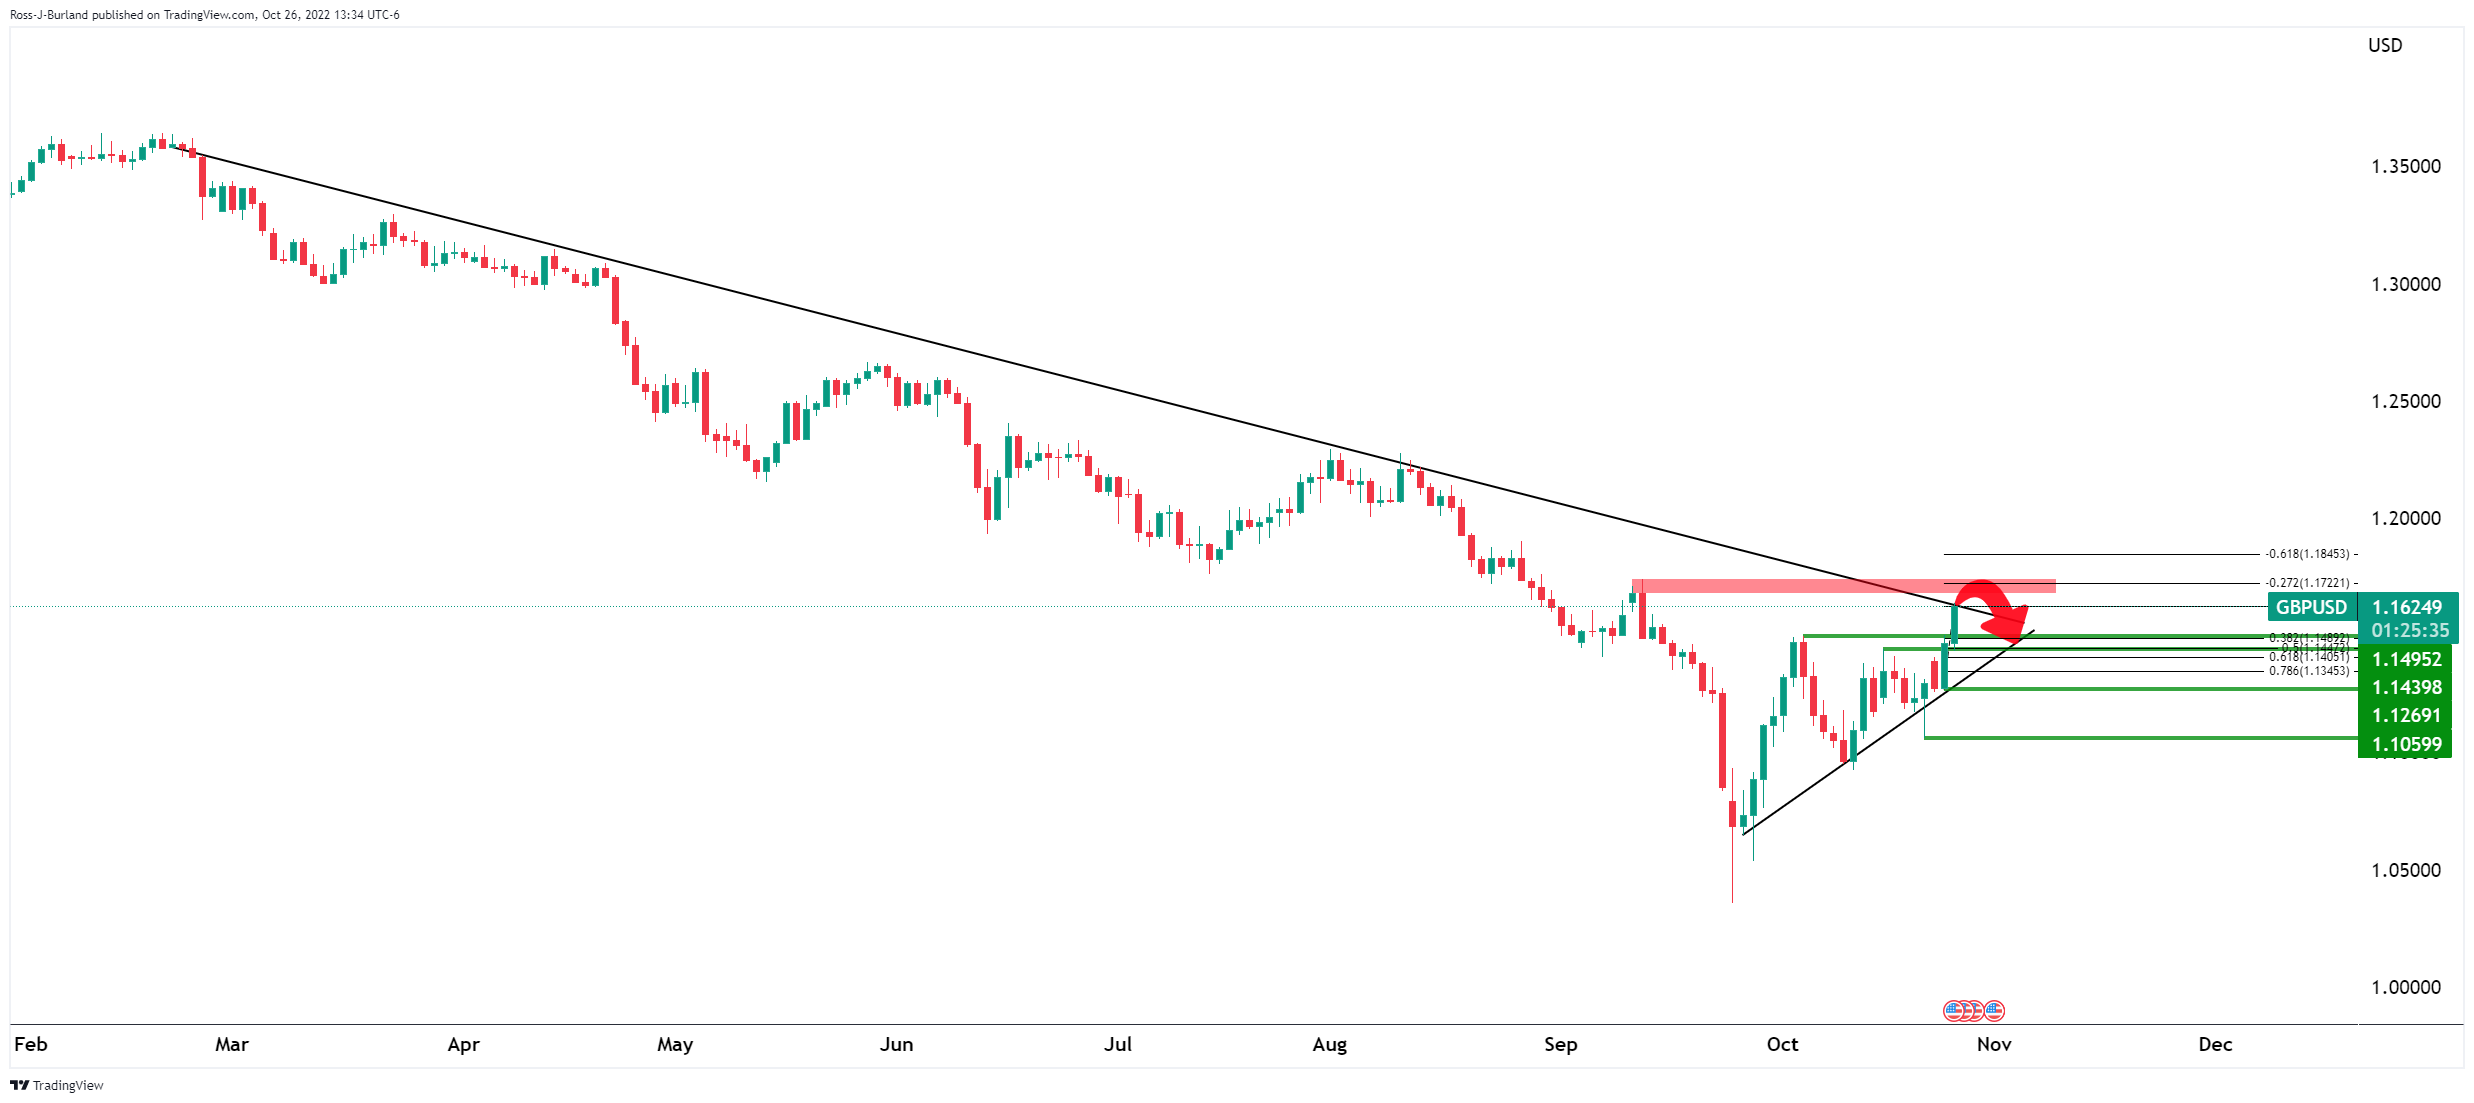
While on the front side of this major trendline, the outlook remains bearish:
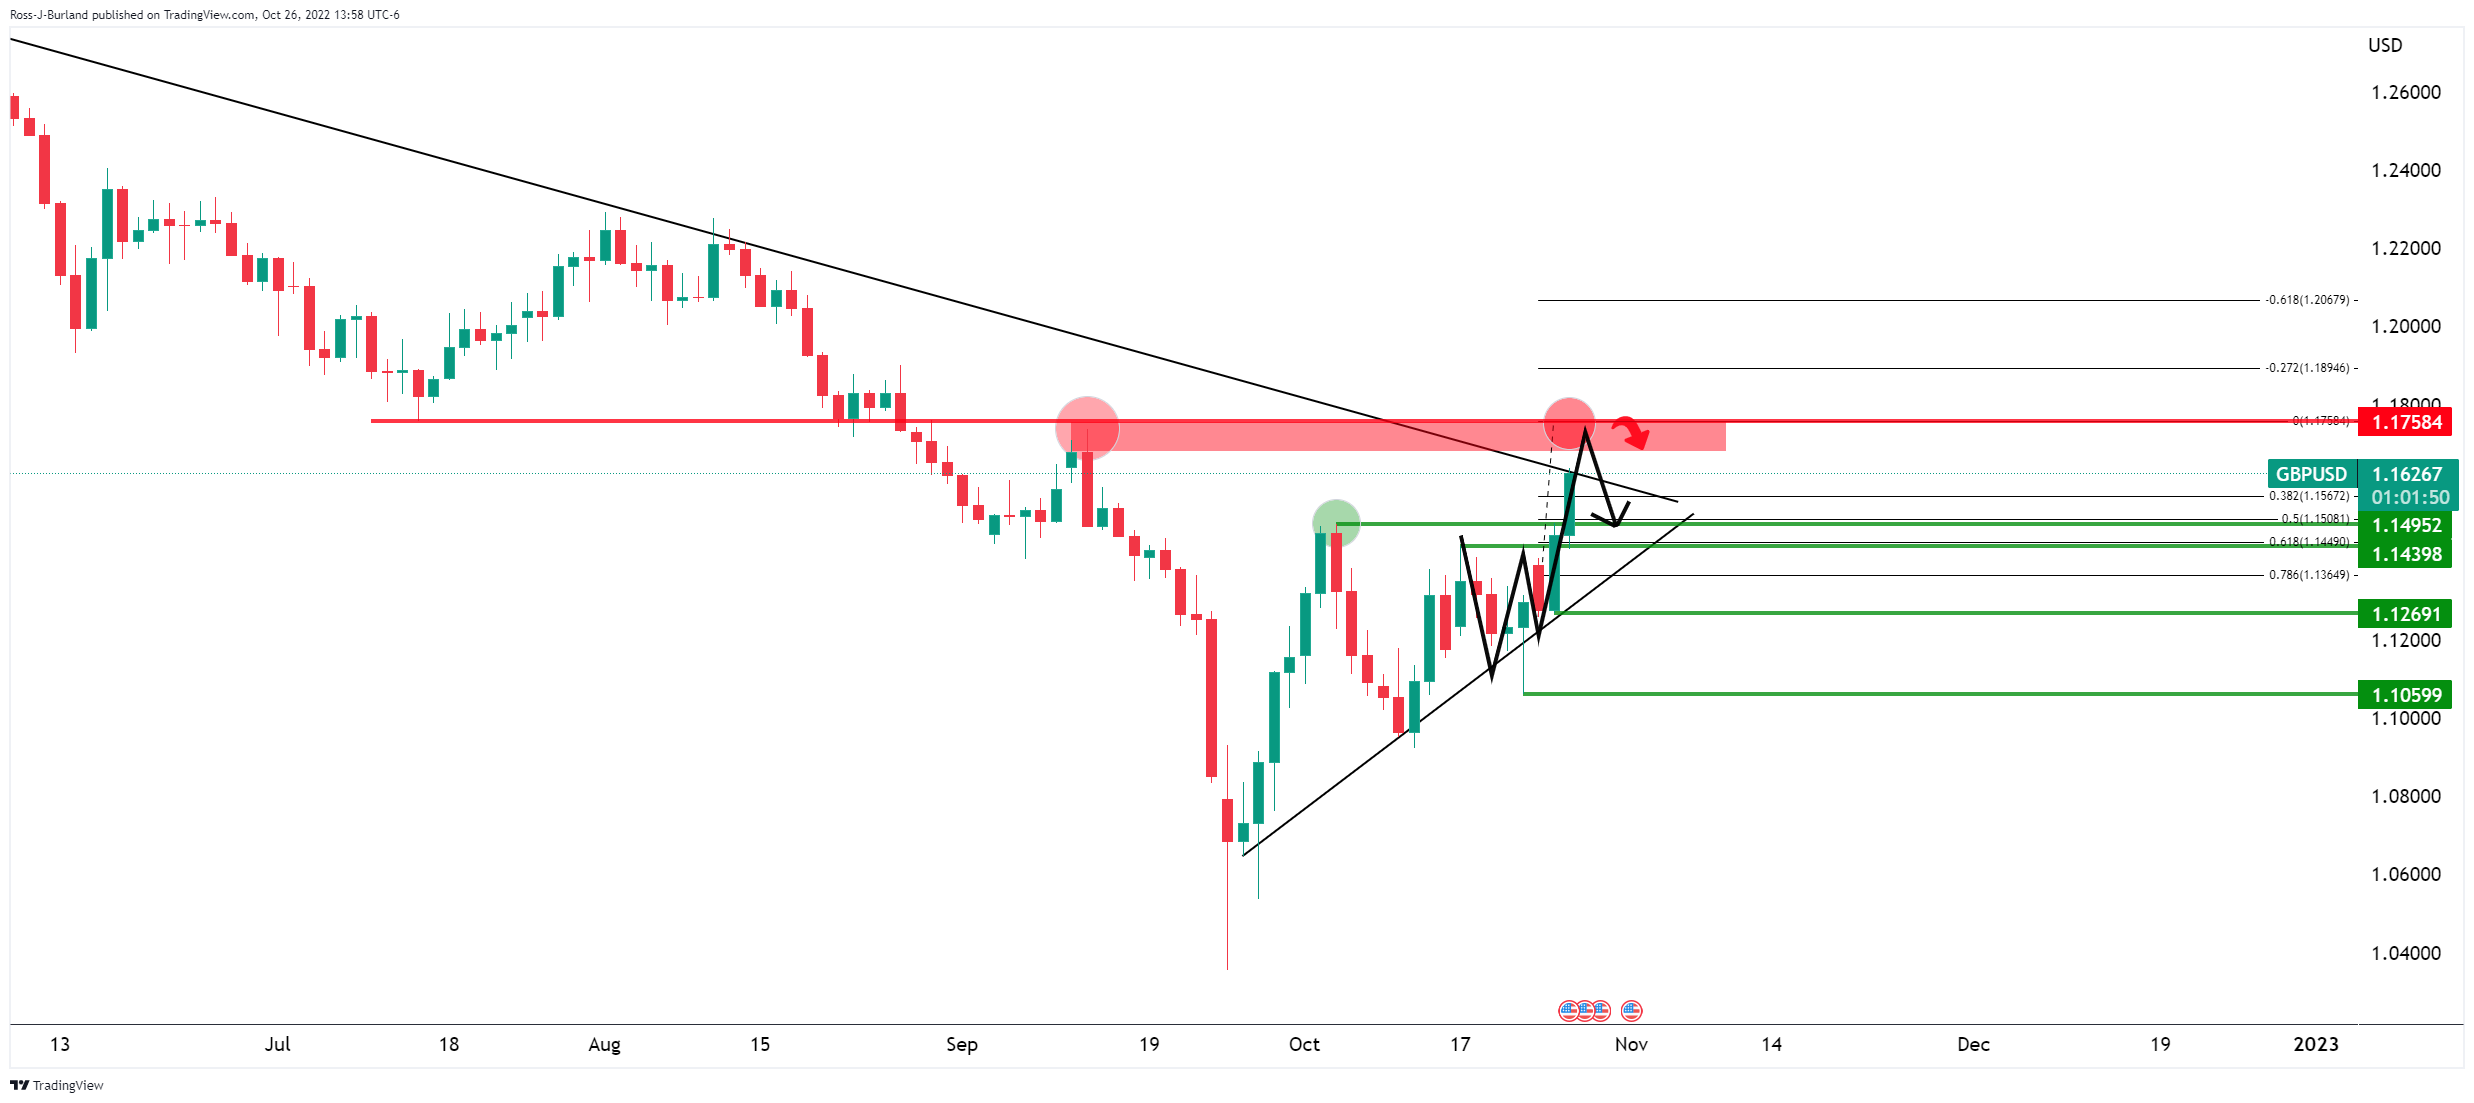
The W-formation is troubling, but a move-in to test the September highs is on the cards prior to a move into the neckline of the reversion pattern as illustrated above. Such a move would be consistent with putting heat onto in-the-money long positions built up over the week in three days of higher highs. The Fibonacci has been drawn from a hypothetical high that marries the September highs. A move into the neckline of the W-formation based on such a measurement will have a confluence with the 50% mean reversion before the 61.8% Fibo on a break below 1.1450. A break of the trendline resistance opens risk of a break of 1.1270 and then a really significant 1.1060 area.